Dashboard
The dashboard summarizes:- Worker online count and load.
- Tasks processed today and throughput changes.
- Task runtime stats (avg, p95, p99).
- Recent activity feed.
Tasks
/tasks/ provides:
- Filtering by task name, worker, state, time range, and search.
- Sorting by state, worker, received time, started time, and runtime.
- Pagination controls.
- Detail view with args, kwargs, results, traceback, and stamps.
- Retry and revoke actions.
- Task graph visualization via
/tasks/<id>/graph/.
/tasks/submit/).
Task graph
The task graph view (/tasks/<id>/graph/) visualizes task relations as the run unfolds.
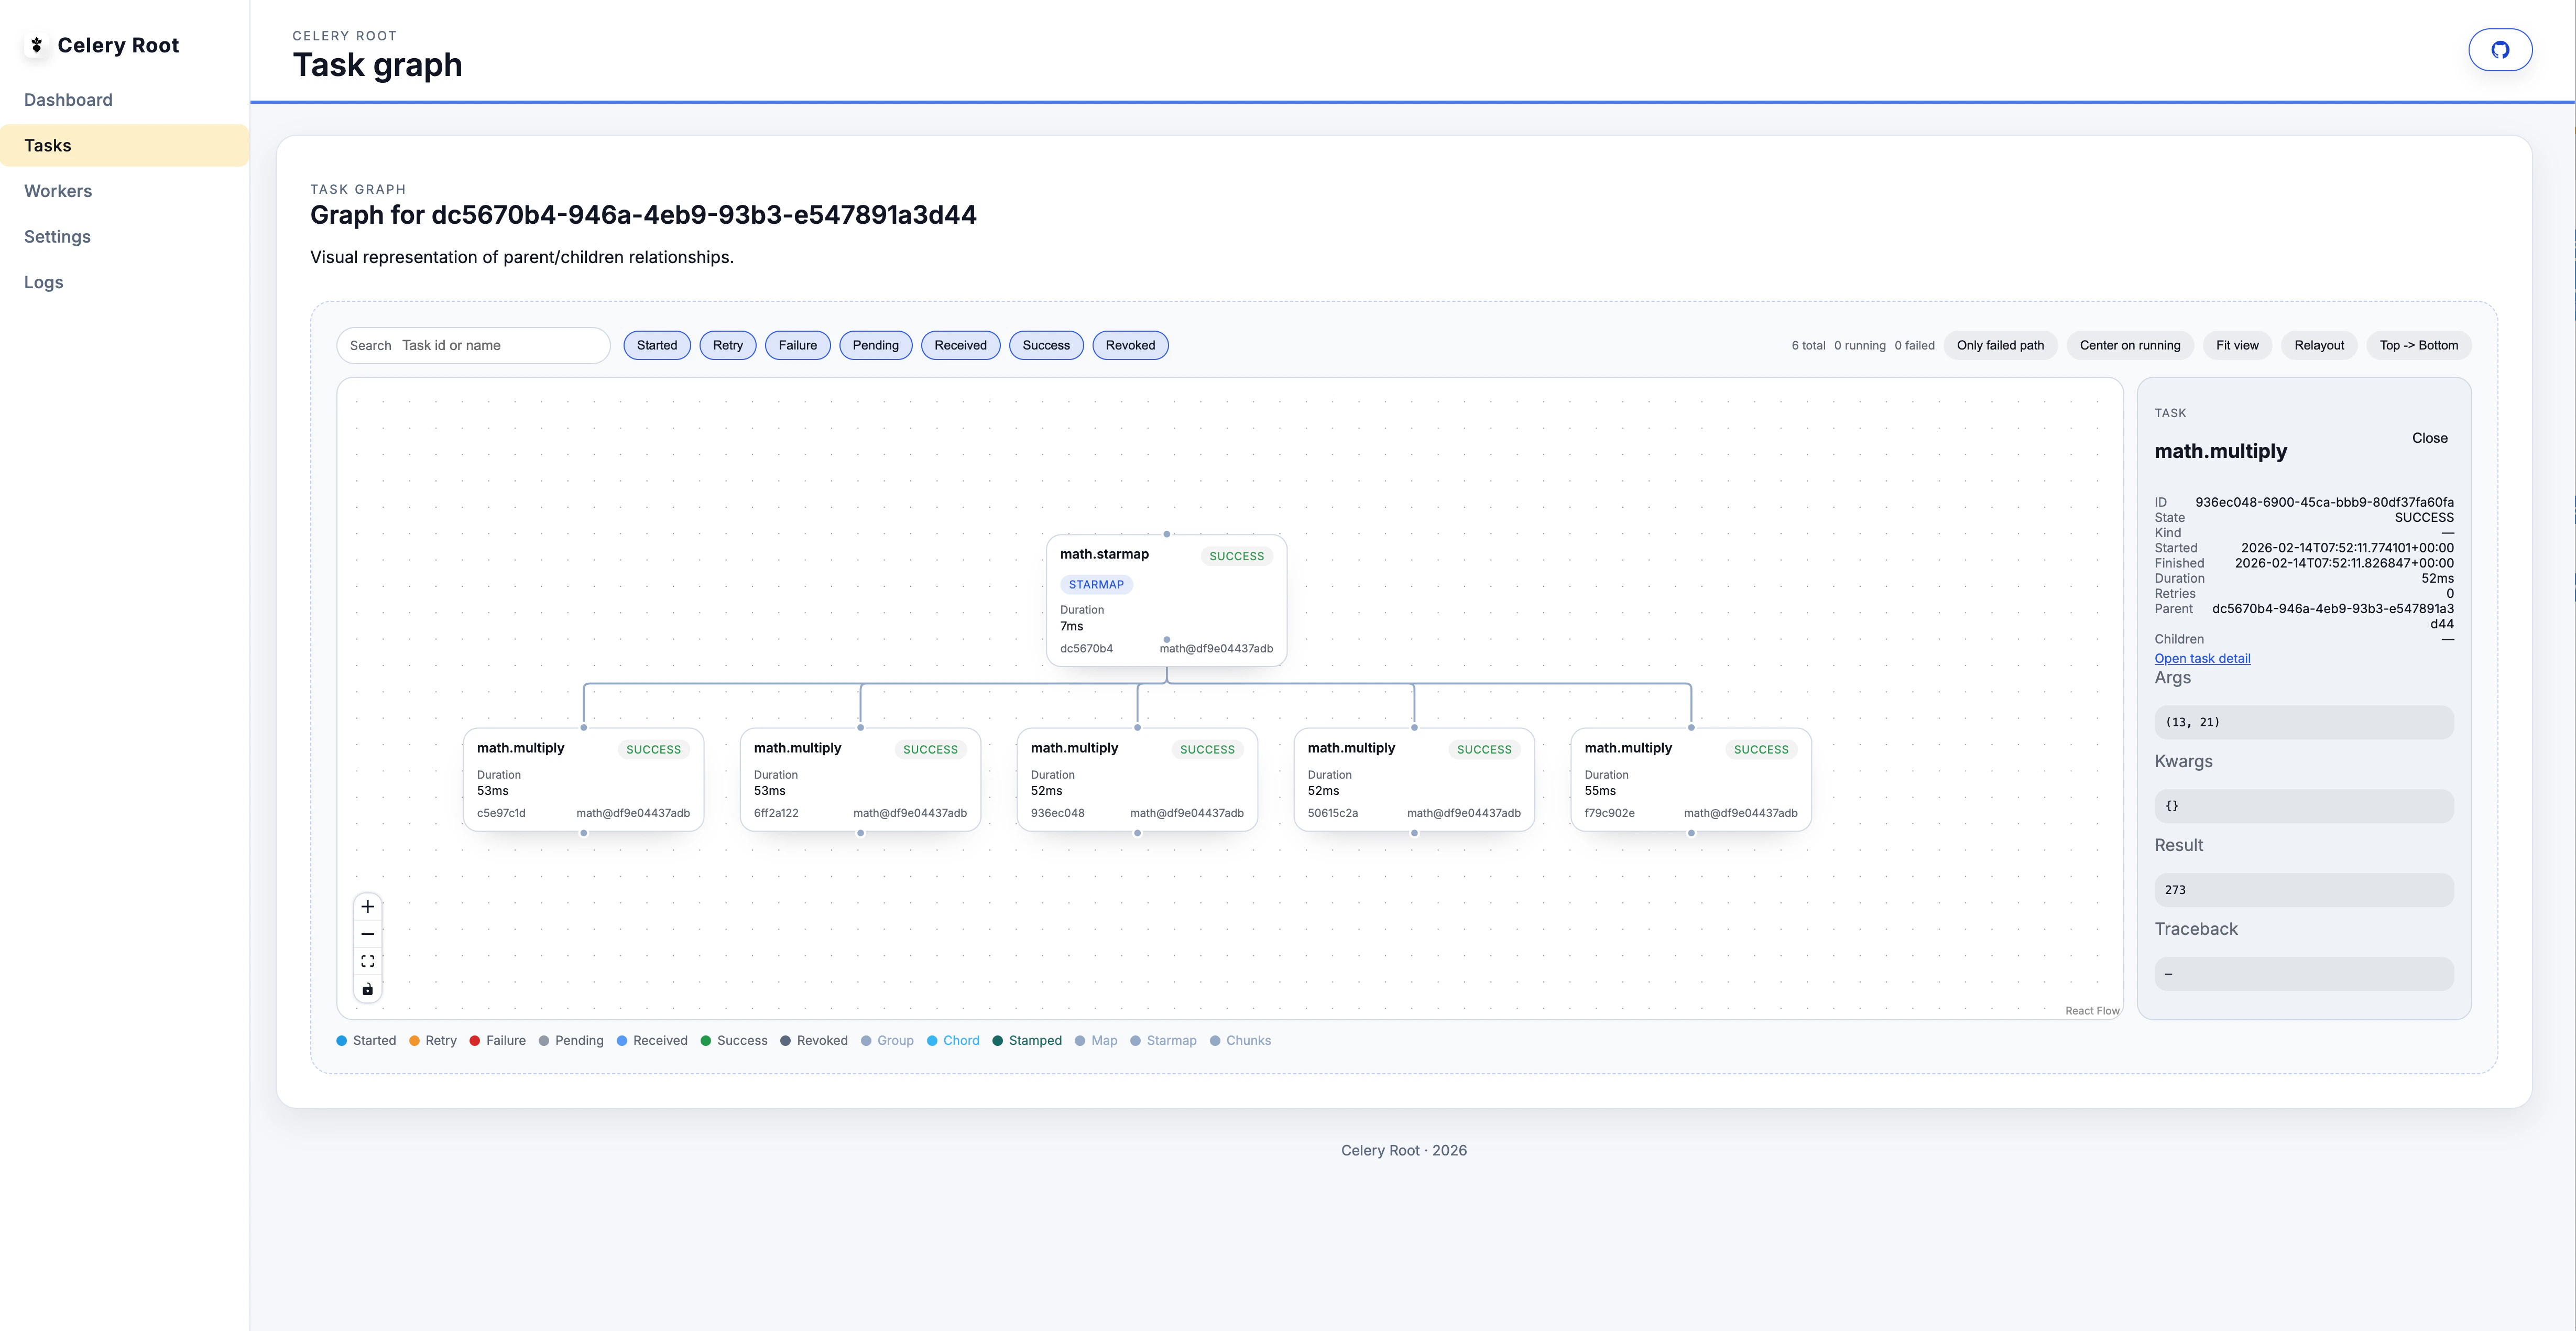
- Inspect nodes to see task name, state, and runtime details.
- Switch layouts between chains, groups, chords, maps, and star-style overviews.
- Watch live updates as tasks complete and downstream nodes unlock.
Workers
/workers/ shows:
- Worker status (online, busy, offline).
- Pool size, active tasks, registered tasks, and queues.
- Broker grouping and per-worker drill-down.
- Grow/shrink the pool size.
- Autoscale.
- Restart workers.
- Add/remove consumers.
Brokers
/broker/ and /brokers/<key>/ provide:
- Queue inventory and counts (best-effort).
- Pending task counts and consumer counts.
- Purge queues and purge idle queues.
Beat schedules
/beat/ lists schedules and allows:
- Add, edit, delete schedules.
- Sync schedules from the backend.
- Detects Celery Root’s DB scheduler or
django-celery-beat.
Logs
/logs/ reads log files from the configured log directory:
- Filter by component.
- Fetch a tail window of lines.
- JSON output with
?format=json.
Settings
/settings/ shows component status and renders MCP client snippets (Codex and Claude). It also reports whether MCP auth is configured.